

Analyzing my personal data using AI
The lazy data scientist edition

I am obsessed with data (which is how this blog started in the first place). In particular, I am obsessed with my data — collecting, analyzing, and understanding different facets of my personal data. This includes data about my exercise, health, sleep, movement, location, and screen time usage.
It’s become tradition to analyze the previous year’s data at the beginning of a new year: I analyzed my 2022 data to investigate my crying patterns, and my 2023 data to understand my patterns of sickness and wellness.
This year, I was feeling a little lazy getting started on analyzing my 2024 data. Then I figured that it was a great time to try out all of the advanced reasoning AI systems that have been coming out. In case you haven’t heard of them, models like Google’s Gemini 2.0 Flash Thinking, DeepSeek’s R1, and OpenAI’s o1/o3 are trained “to ‘think harder’ when tackling complex challenges” (OpenAI) or “to generate the ‘thinking process’ the model goes through” (Google). Other models, such as Google’s Deep Research and OpenAI’s homonymous Deep Research, have been designed to conduct extensive research projects.
In this article, I’ll walk you through the entire process, from data collection and curation to having the different AI systems analyze my data, and my meta observations on using such systems to be your personal data science assistant. Through this entire process, I try to answer the question: How good is each AI system at an ambiguous, open-ended data analysis task?
Note that all opinions in this article are strictly my own and do not represent views of my employer or any other companies mentioned.
Data Preparation
Step 1: Download and clean datasets
I first downloaded and cleaned my data from different sources and merged them into one single file, which is what I gave to each AI system. I could have provided each AI system with multiple files (e.g., one for exercise data, one for survey data, etc), but I wanted to control as many variables as possible. This approach allowed me to test each AI system's ability to analyze data without them getting tripped up on the data cleaning part. This was especially important since much of the data cleaning relied on my own knowledge of which variables were important, specific ways I wanted certain columns cleaned, and which elements were unimportant or noise.
It helped that I already had a lot of the framework set up from previous years. In this way, I combined data from:
Apple Health, which included fields such as step count and heart rate
Screen time data, which included number of seconds spent on different applications across phone and computer
Survey data, which I fill out at the end of every day to track aspects of my life that wouldn’t be captured automatically, such as how often I drank alcohol, washed my hair, or called my mom
Side Note: Normally, I'd use Google location data as well, but this year I couldn't because of recent changes to how Google Maps handles Timeline data. Google now auto deletes Location History data after a certain period, unless explicitly configured otherwise. I hadn't realized this change, and thus had less data available than in previous years. For anyone using location data similarly, I recommend you turn this feature on and also back up your location history.
Step 2: Describe the dataset in as much detail for the AI system
Some of the columns in the final dataset were pretty self explanatory (e.g. “Step Count” or “Mean Heart Rate”). However, others merited a bit more description, such as which fields were automatically or manually collected, or why it mattered. The more descriptive I could be, the better the AI system could unambiguously understand each data field and make fewer assumptions.
Step 3: Ask each AI system to analyze your data
I used the following AI systems in my experiments: ChatGPT 4o, Claude 3.5, Claude 3.7, and Gemini 2.0 Flash. I also included OpenAI Deep Research and Google Deep Research systems.
Note: I refer to all the systems under test as “AI systems” as it is possible that under the hood, some are not single models.
For each AI system, I attached the data as a single CSV and asked the question: Can you analyze the data and give me a summary of the main patterns and trends you see and also give tips/suggestions for the new year?

Summary of Findings
The main finding of all of this is that none of the current AI systems are quite ready to replace me in the job of analyzing my own personal data (so far 🌞).
In the ideal scenario, I would give an AI system my dataset with a high level description, and it would in turn generate me a nice report showing highlights from the year and actionable items to improve the upcoming year. All of the AI systems I tested fell pretty short of that (admittedly difficult to measure) bar/vibe check.
The thing is, all of the insights shared by the AI systems looked great. At first glance, I found myself nodding along to whatever insights, recommendations, and numbers they shared. But once I started digging into my own data in parallel, I started finding various problems: the numbers of figures shared didn’t make sense, some of the fields were made up, and the plots created didn’t make sense or felt kind of useless. I’ll dig into some of these in the next section.
Deep (research) hallucinations, from making up new fields to falsifying values
Deep Research systems are tailored to be good at deep research projects, things like planning travel or doing research based on information on the Web. In fact, I thought of them (both Google’s and OpenAI’s) as the AI systems most capable of summarizing and synthesizing large amounts of information.
However, as I found out through this exploration, they are not very good at doing deep data science research on a single dataset.
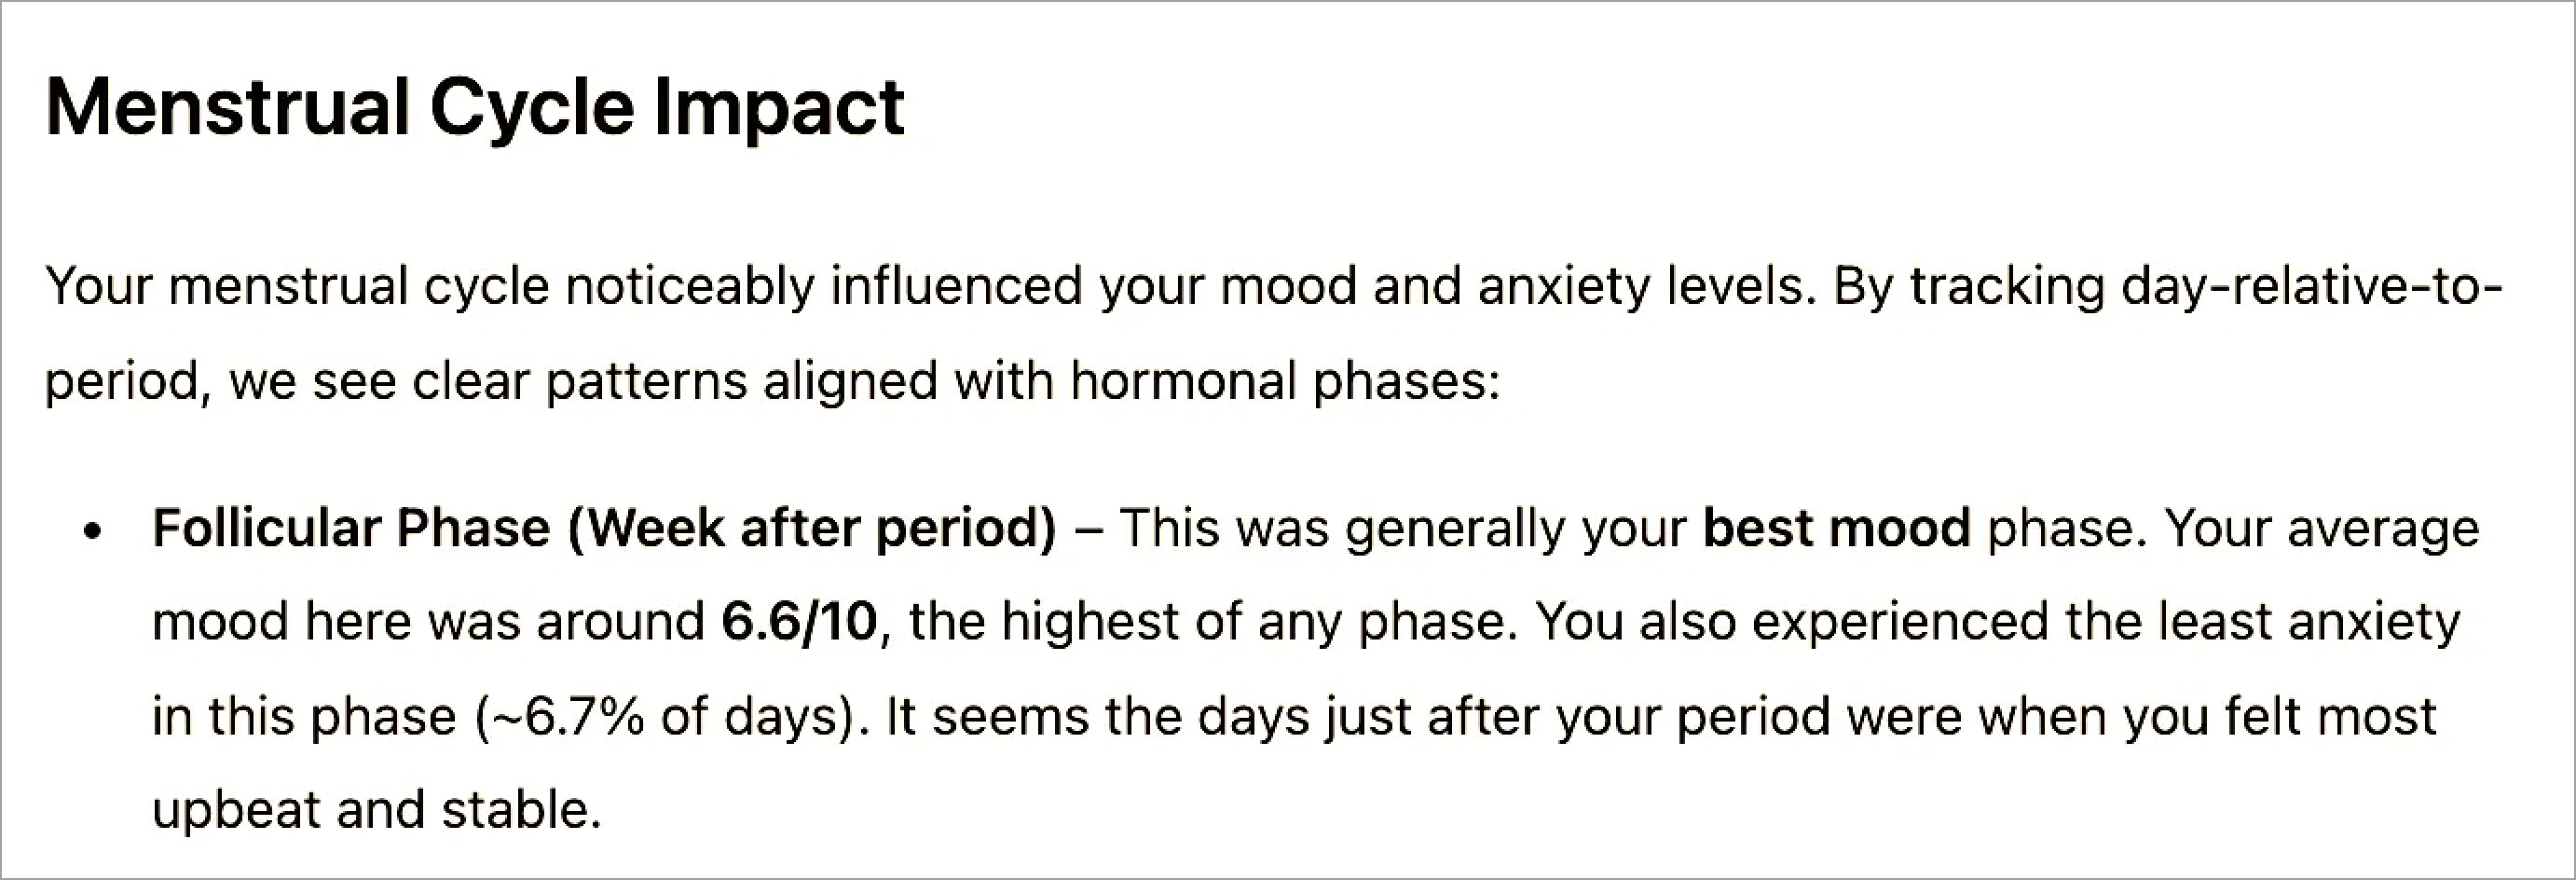
Making up fields. OpenAI’s Deep Research claimed that I had the best mood during my follicular phase. While I am sure this was true in some ways, it hallucinated the “mood” field, which is not something I tracked in my data at all.
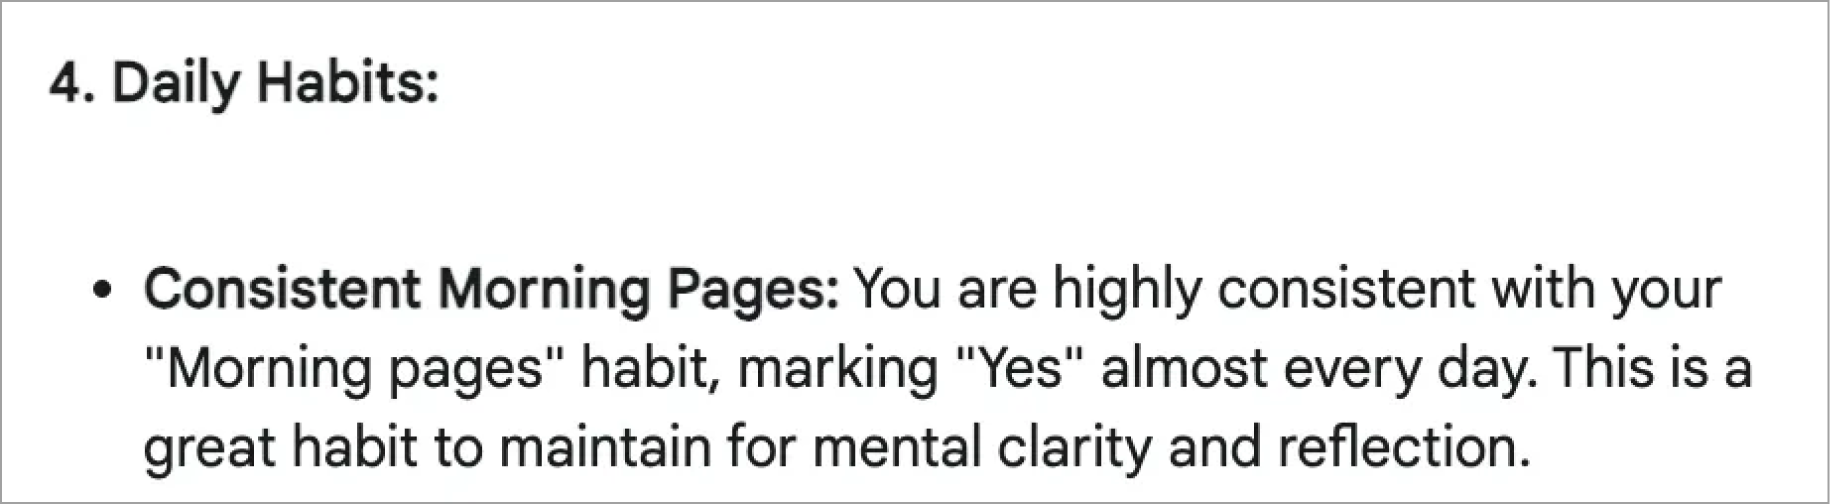
Making up habits. Google Deep Research also included some hallucinations, such as claiming that I was consistent with writing my morning pages, but I know (without even having to look at my data) that this is not true, as I stopped writing morning pages halfway through the year at all.
Making up numbers. OpenAI’s Deep Research observed that I spent an average of 3.3-3.5 hours per day on my phone, with higher screen time in colder months, which it attributed to my being indoors more and being on my phone more. Sounds reasonable, right?
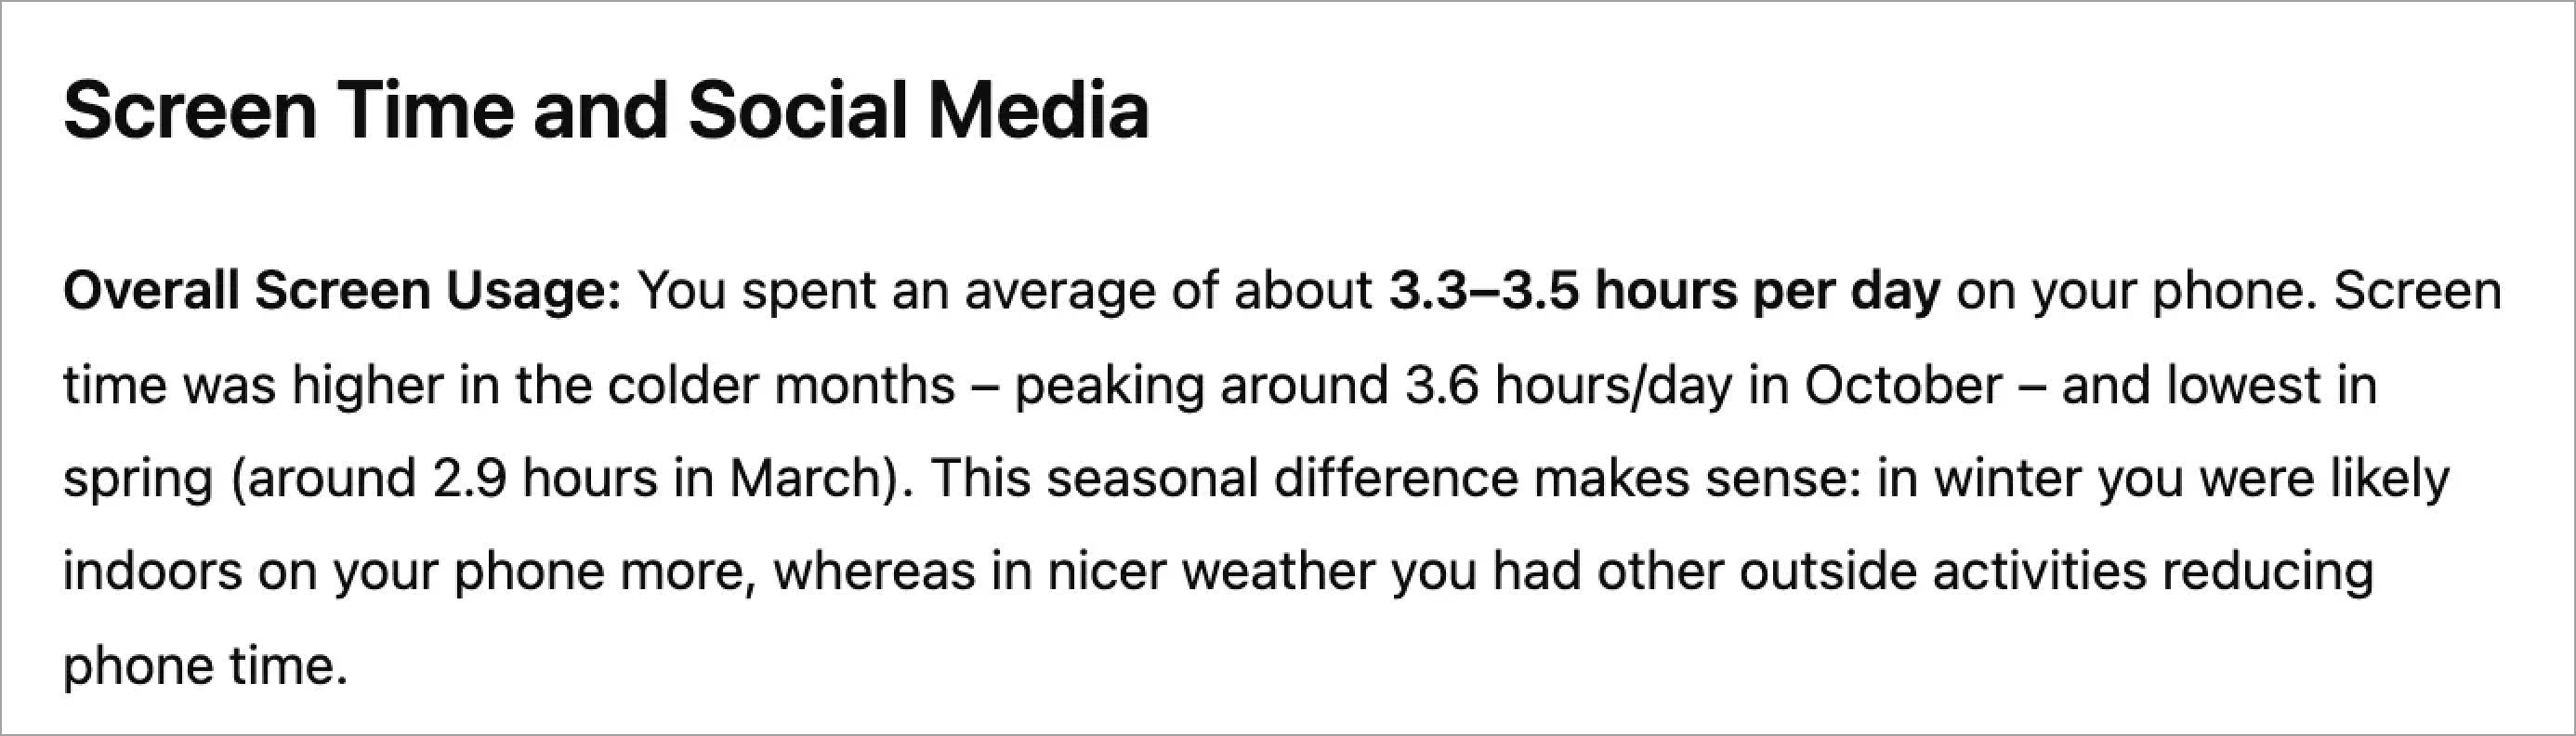
But when I calculated this value from my actual data I got very different numbers. The reality (according to the data) is actually an average of 1.5 hours per day, with no noticeable difference among the “colder months”. In fact, it looks like my phone usage was below-average in the colder months like November, December, and March.

Addendum: The above OpenAI deep research results were tried using GPT 4o. I tried ChatGPT 4.5 with deep research after this article was written, as it was only made available to me very recently. I found that it was much better about the hallucinations.
Running code behind the scenes helped to reduce hallucinations… sometimes
Some of the AI systems ran code (usually either Python or JavaScript) behind the scenes to actually “analyze” my data. In theory, this should minimize any data-related hallucinations in the resulting output.

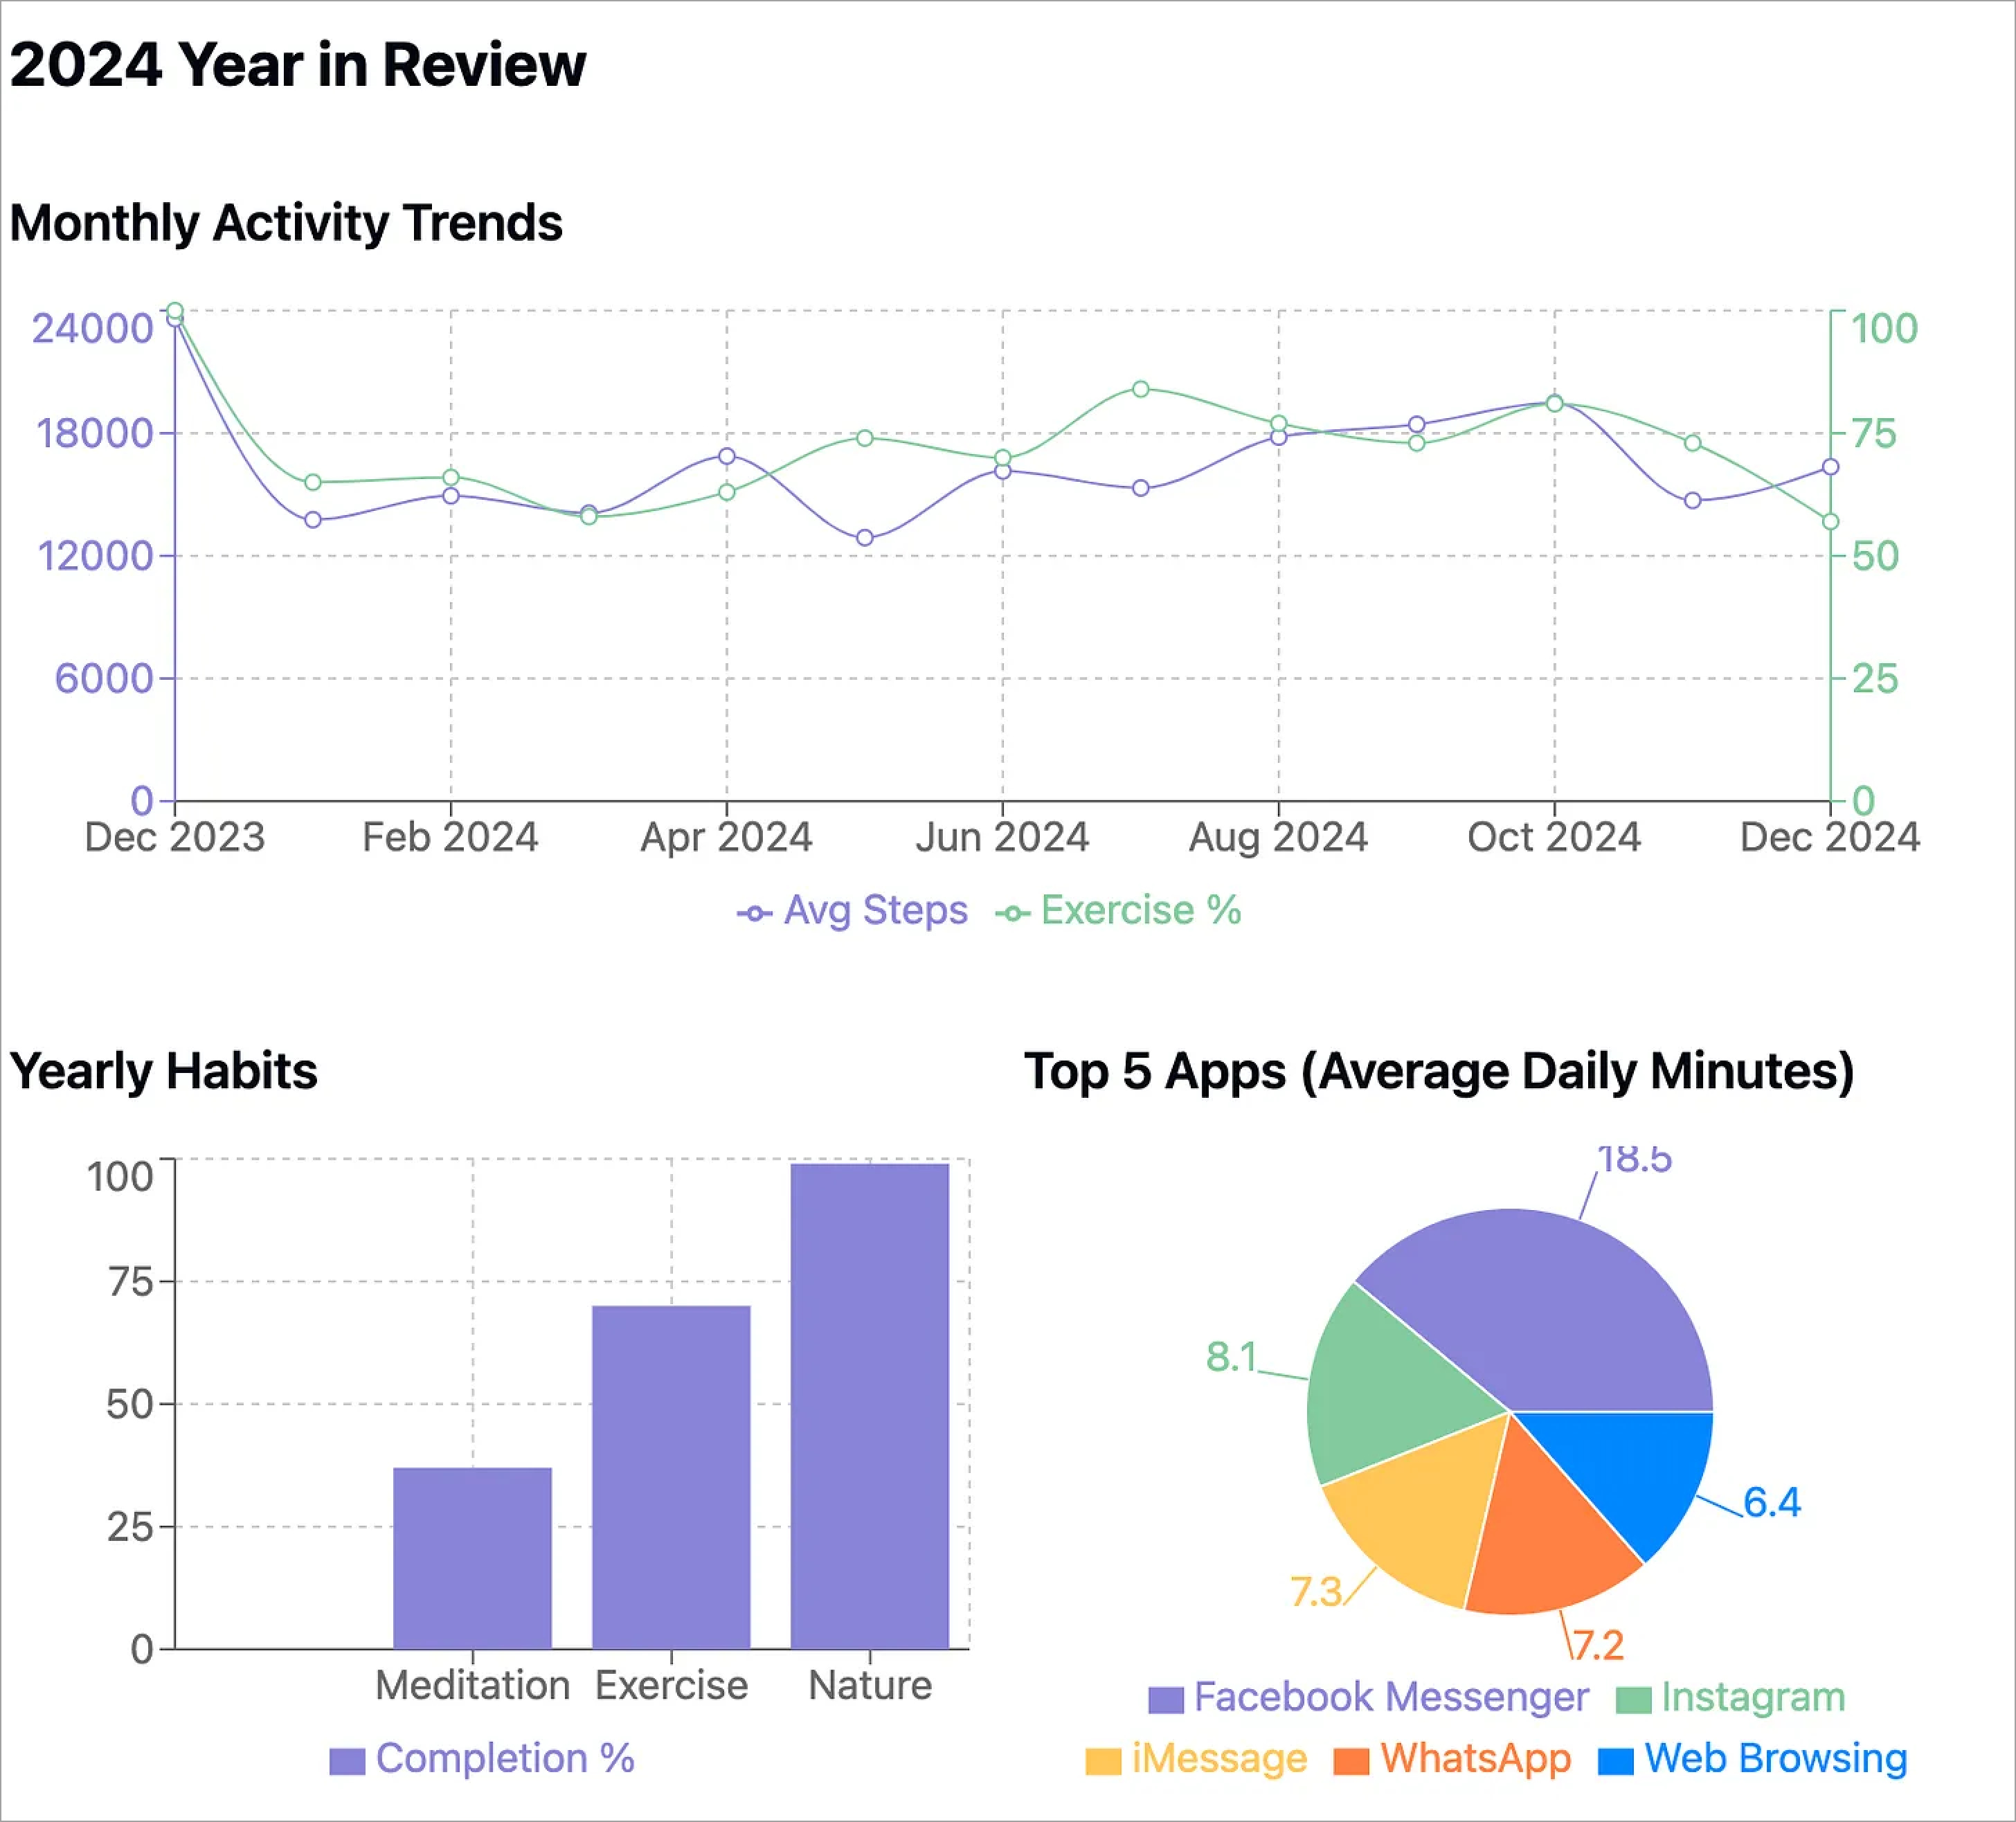
In many cases, running code did result in correct numbers. For example Claude 3.5 observed, “You maintain a good activity level with an average of about 15,900 steps daily”. GPT-4o similarly observed, “Your average daily step count is quite high (~15,921), indicating good activity levels.”
I double checked this in the data and they were both indeed accurate – which was nice to see that none of the AI systems were hallucinating something as simple as my step count.

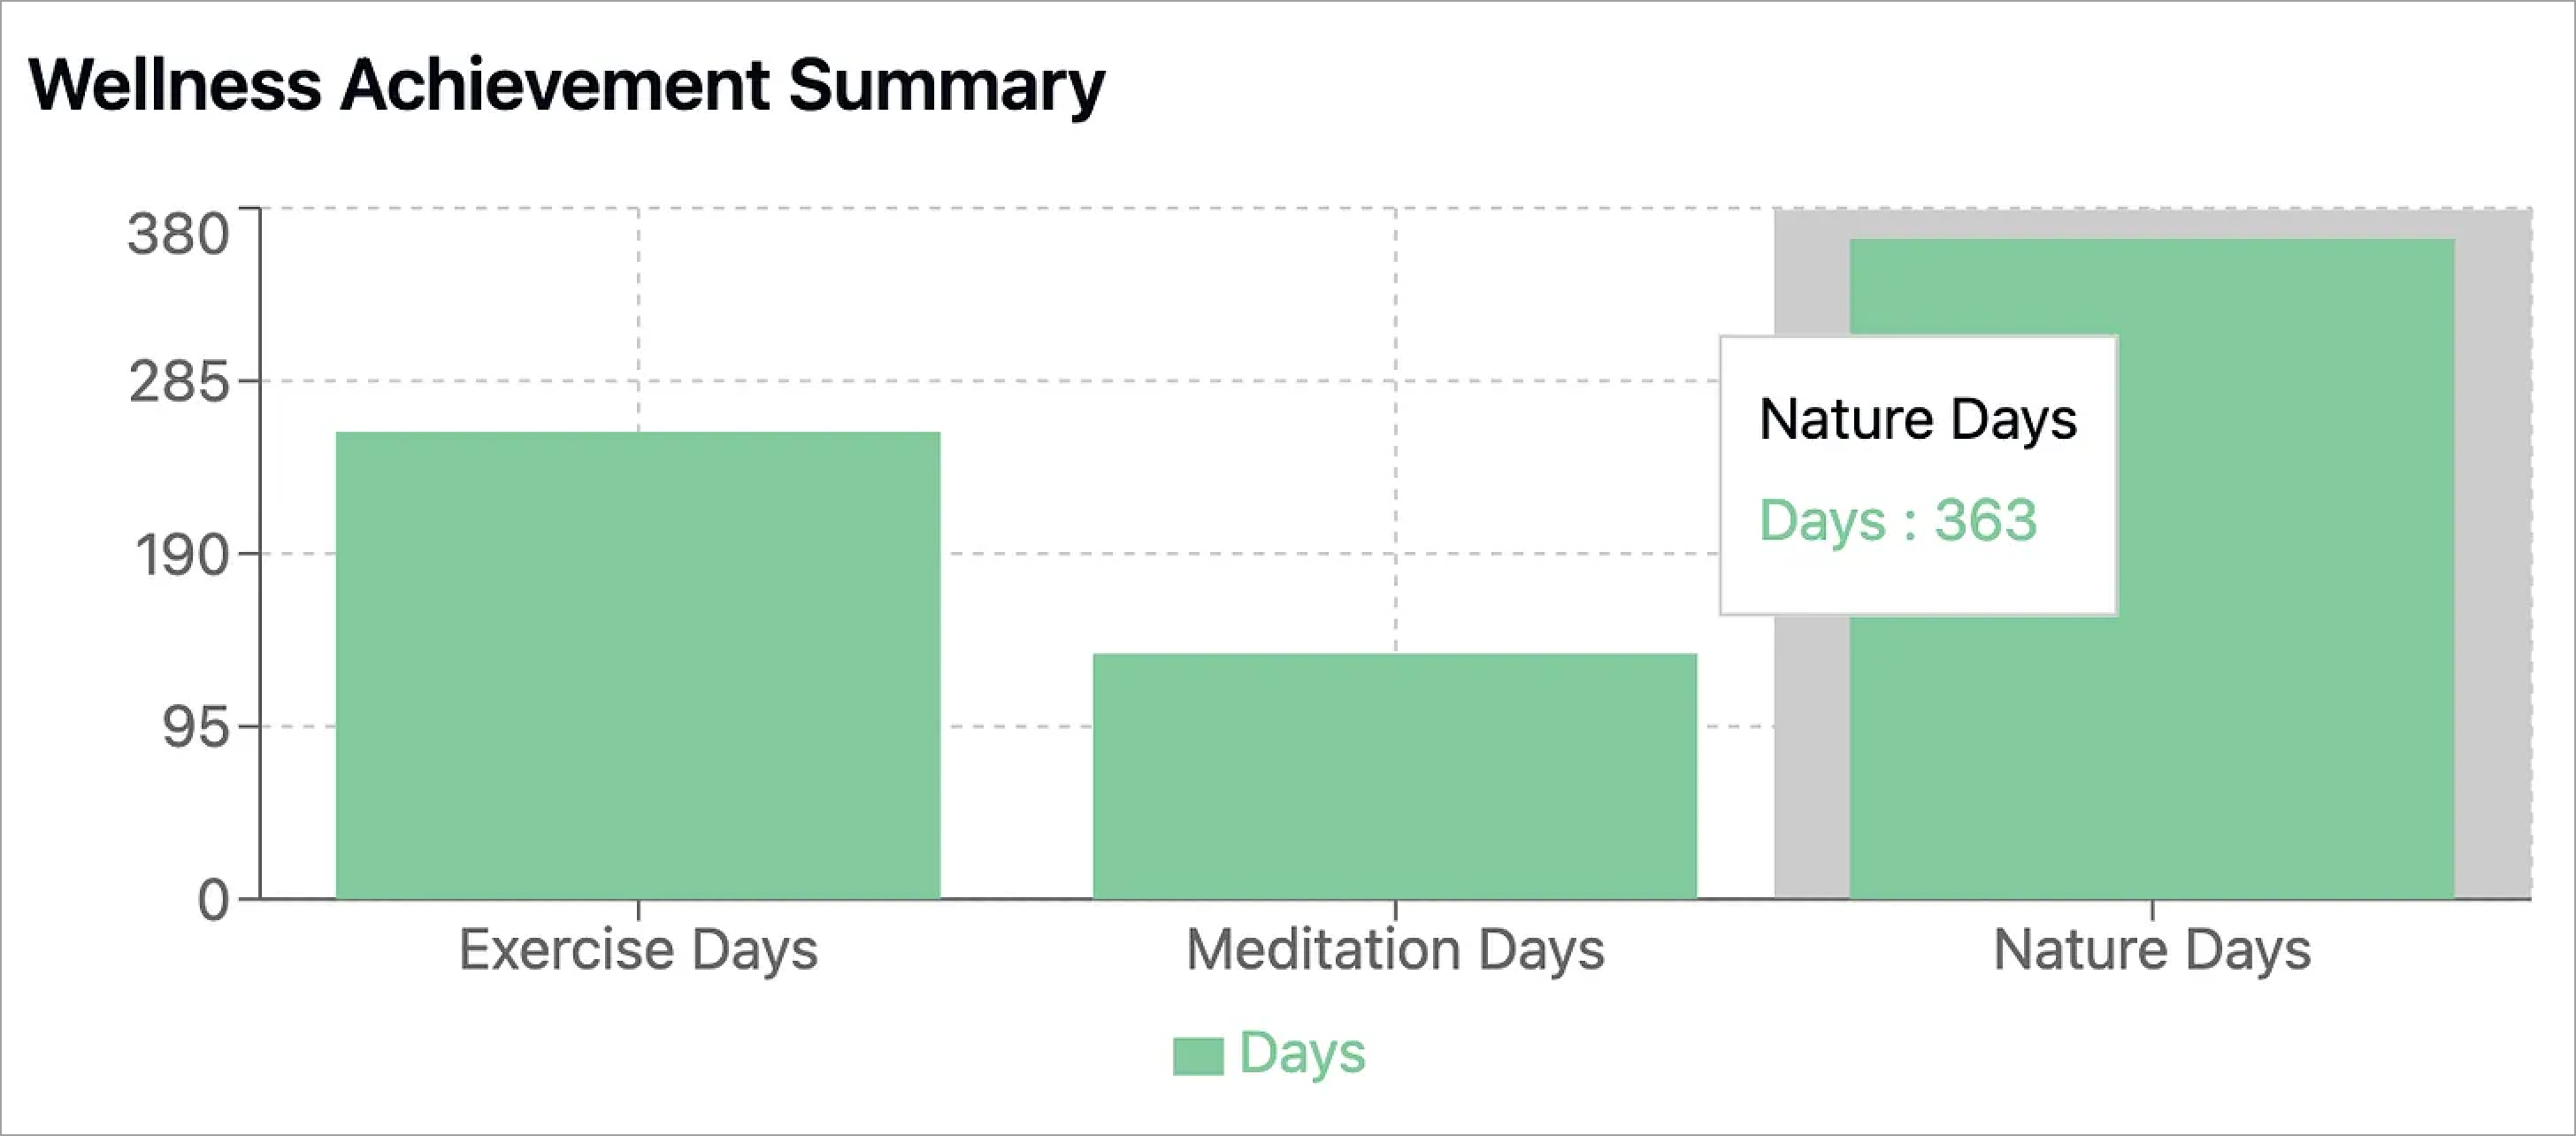
However, just because the AI system ran code didn’t mean it wasn’t hallucinating. For example, Claude 3.5 created the following plot summarizing my “wellness achievements”. In the plot it shows that I was in nature for 363 days in 2024. This is just not true, although I wish it were.
Some of the generated plots were not very useful
When the AI systems were not making up data fields and numbers, they were able to create some plots. However, just because it was able to generate code and create a plot did not mean that it was useful.
This is getting a little into “vibe check” territory, but I guess at the end of the day these AI systems still lack the insight into what plots might be more meaningful or helpful to users, often generating visualizations that are not especially useful or informative.
For example, GPT-4o generated the following plot to show my anxiety (which I logged as either Yes/No). I think this plot is difficult to read and is not very informative at showing which time periods I tended to have anxiety. Because anxiety was logged as a binary Yes/No choice, this sort of data would have been better displayed using some sort of line or bar plot aggregated over a weekly or monthly time period.

In another example, Gemini 2.0 Flash generated this plot of resting heart rate vs. mean heart rate. While interesting, I am not sure what I am supposed to do with this plot, as it did not come with any interpretation. Is this normal? Is there a certain area of the plot I should be paying more attention to? Why should I care about this?

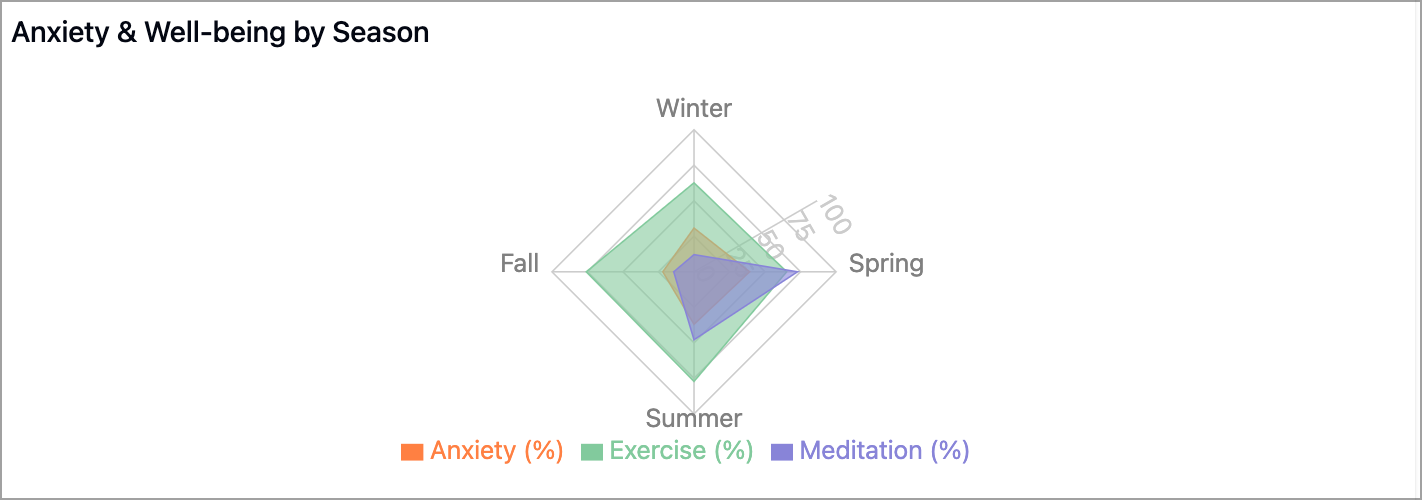
Claude 3.7 generated the following plot showing several habits by season. While creative, it is difficult to read, and the axis is confusing. The more I stare at this plot, the more I feel like I am being sucked into a vortex.
Some of the insights and recommendations were very generic
I found that a lot of the insights and recommendations shared by some of the AI systems did not feel personalized to the data I shared. For example, “Increase consistency in meditation” (GPT-4o) or “Explore stress management techniques like mindfulness, exercise, and setting boundaries” (Gemini Flash 2.0).
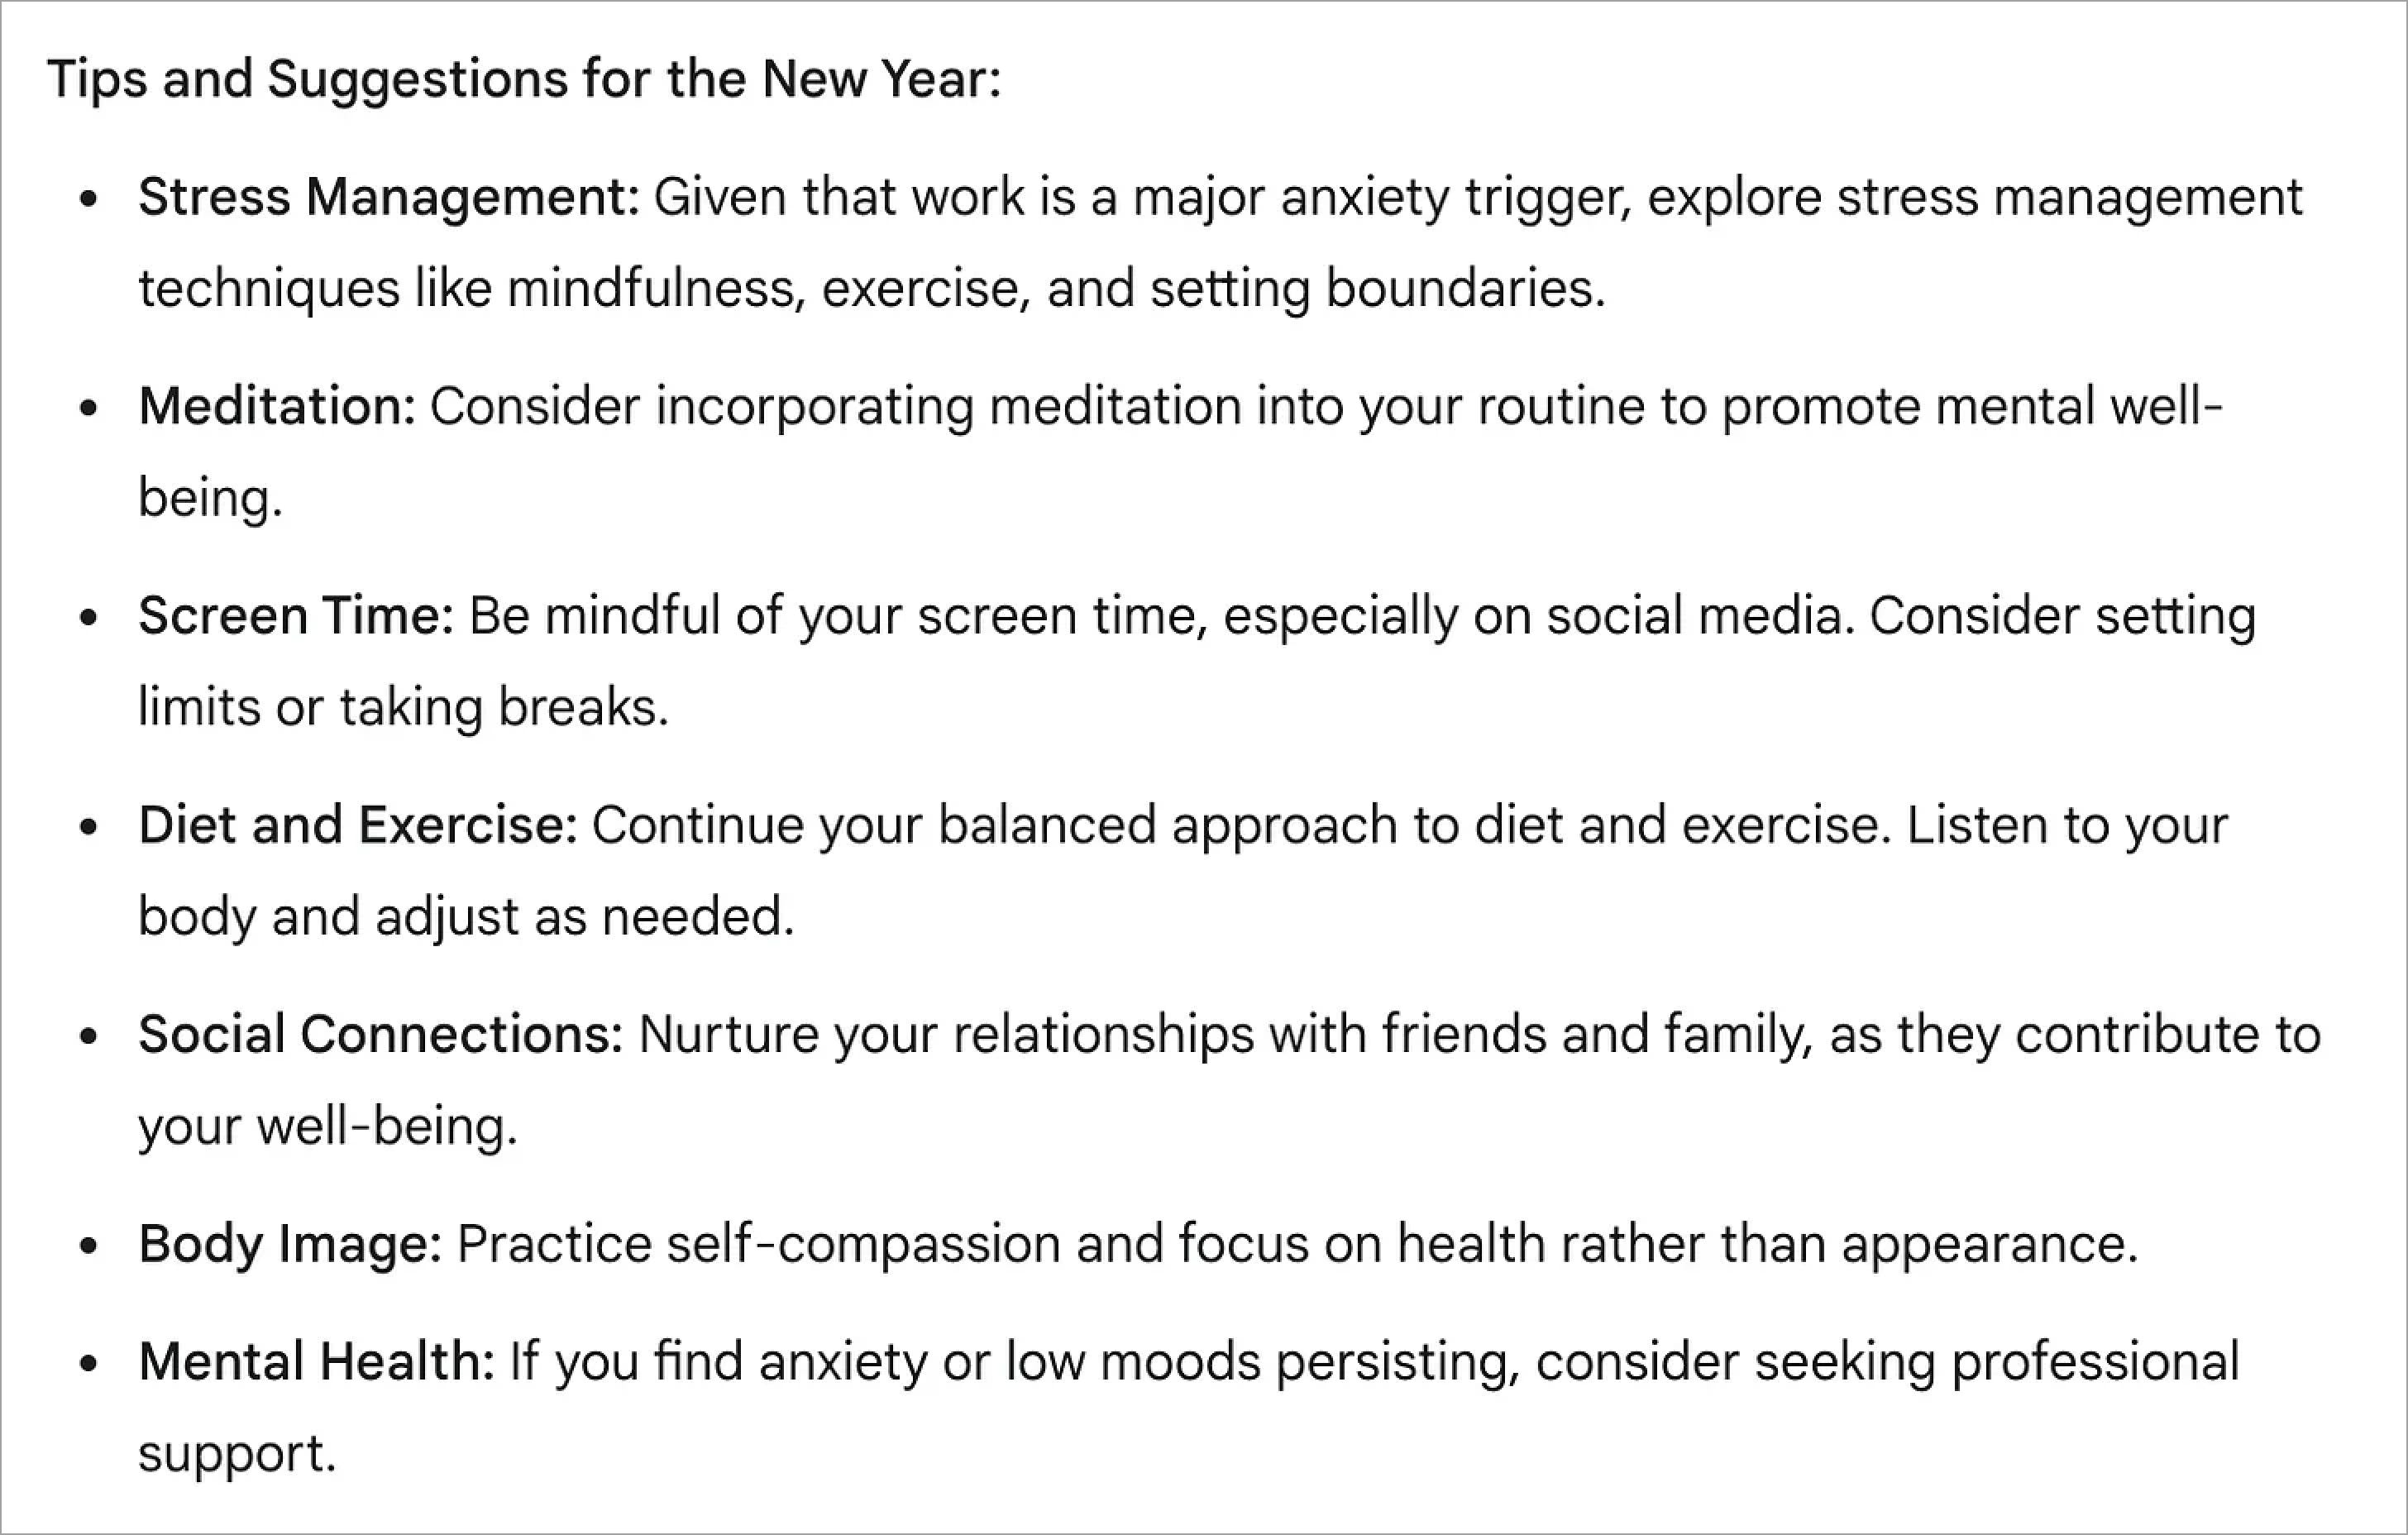
Yes, I know these are good things to do. They’re just very generic and the AI systems could have told me these things without having looked at any of my personal data.
Redeeming qualities
I’m not here to just fully tear apart all of these systems. Being able to automate a data science project is not easy, especially if the project is pretty open-ended. Some analysis is quite straight-forward (e.g. “What months were step count higher in?”) whereas others are a lot more difficult, ambiguous, and open-ended (e.g. “Which of my habits were most correlated with my anxiety?”).
Overall, it was really cool to see that these various tools could go through the full end-to-end process — from loading in the data, crunching (some) numbers, creating plots, and generating recommendations. The output I got resembled what I was looking for. It was only once I started digging into things that I realized that some of the numbers were made up, or that some of the generated insights were generic or not actionable.
Plots were often interactive — you could often hover over different portions of the chart and it would show the number corresponding to that area. From an aesthetic standpoint, I thought Claude had the prettiest plots.
Some closing thoughts
Overall, it was interesting and enlightening to try out all of the different advanced capability AI models on my personal data and compare them based on (quantitative) numbers and (qualitative) vibes.
If you wanted to try this on your own, you have to be okay with these companies having access to your personal data. I think this is another important reason to be more hands-on in the data cleaning part, to make sure if you have extra sensitive things, you can remove those before sharing them with the AI system.
With today’s tools, if you wanted to use your favorite AI system to do data analysis for you, I recommend simpler, less open-ended, or well-defined tasks, and maybe verifying across multiple tools to ensure accuracy.
I’m going to keep collecting my data this year. These AI tools are developing very rapidly, so it’s very likely that the tasks they struggle with today will be easily solved within a few months. We’ll see at what stage these tools are in at the beginning of next year, when it’s time to analyze my 2025 personal data!